Exploring the relationship between public education spending and Standards of Learning (SOL) outcomes
When a local school division claims to be ‘one of the best’ (or ‘the best’) school divisions in the commonwealth, how should that claim be assessed? Alternatively, when claims are made that public schools are inefficient and mismanaged, what real evidence can be brought to bear?
Understanding how public investment in education translates into student success is a perennial challenge in education policy. In Virginia, where local school divisions vary widely in size, demographics, and fiscal capacity, the question of how spending influences student performance—including on the state’s Standards of Learning assessments (SOLs)—is both timely and complex.
This blog aims to take a fresh look at the relationship between local public education spending and SOL pass rates across Virginia’s school divisions. It explores how spending levels, funding sources, and local cost variations intersect with student outcomes, offering insights into the nuanced dynamics of educational performance and equity in the commonwealth.
Why this topic matters
Public education is one of the most significant expenditure responsibilities of local governments in the Commonwealth of Virginia. In Virginia, local school divisions are responsible for delivering high-quality education under the framework of the state’s Standards of Quality (SOQ). These standards mandate minimum staffing and service levels, but localities often go beyond them, tailoring their educational offerings to community needs.
Understanding how spending relates to student outcomes is essential for policymakers, educators, and taxpayers alike. It informs debates about local spending, funding formulas, equity, and the role of local autonomy in shaping educational success. Yet, as this analysis shows, the relationship between dollars spent and test scores achieved is anything but straightforward.
The challenge of measuring educational impact
Before diving into the data, it is important to acknowledge the inherent complexity of measuring education outcomes. Student performance is co-produced by a constellation of factors: the quality of instruction, the learning environment, family support, and broader socio-economic conditions. Public spending on quality instruction is one input among many.
Moreover, standardized test scores—such as SOL pass rates—offer only a partial view of school performance. Schools that prioritize test preparation may appear more successful on paper, while those that take a more holistic approach to education—by complementing their focus on core academic topics with arts, music, social-emotional learning, or workforce skills) might not score as highly on standardized test, despite offering a rich educational experience. In short, SOL scores are a useful but incomplete proxy for educational quality.
Visualizing the data: spending, performance, and funding sources
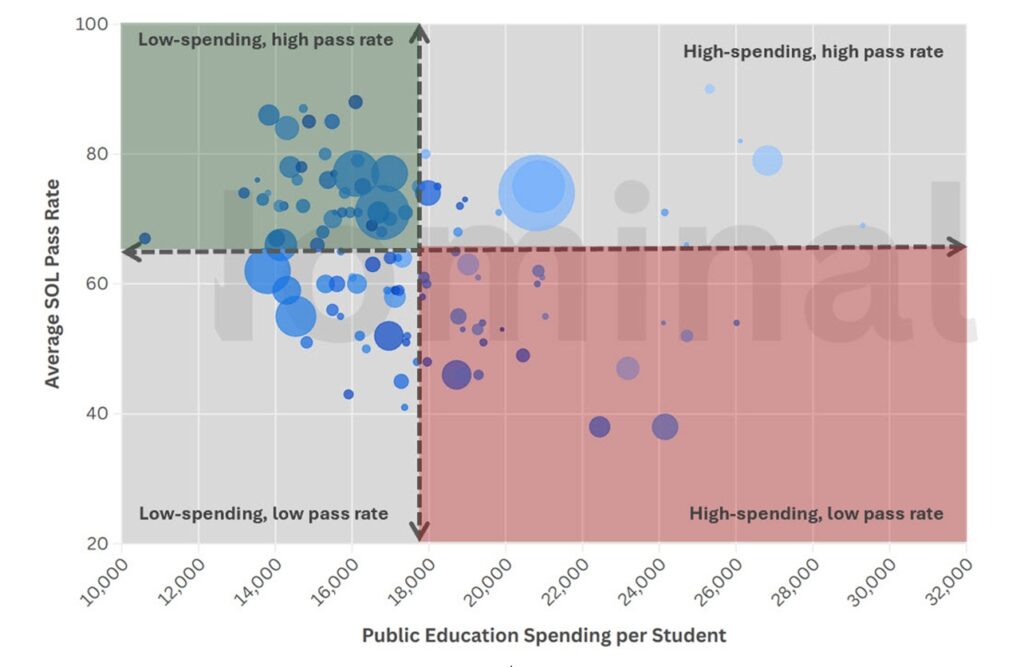
Data was gathered from a number of official sources and combined into a scatter plot, showing the relationship between per-student public education spending in each local school division (on the horizontal axis) and the school division’s average SOL pass rate for eighth grade reading and math (on the horizontal axis).
The bubble size of each observation also shows the total enrollment (or ‘membership’) of the school division, while the bubble’s color shows the degree of reliance on intergovernmental revenues. Lighter colors indicate greater reliance on own revenue sources, while darker indicate greater dependence on intergovernmental revenues from the commonwealth and the federal government.
The interactive scatter plot shows that school divisions in Virginia vary considerably, both in terms of their per-student spending levels, as well as in terms of learning outcomes.
On average, Virginia school divisions spend 17,652 dollars on public education per student, resulting in an average SOL pass rate of 64.5 percent. However, greater spending is not necessarily associated with higher test scores.
In fact, at face value, the visualization of education spending and SOL results data for Virginia school divisions reveals a somewhat surprising pattern: a negative correlation between per-student public education spending and average SOL pass rates.
In order to further interpret the data, the chart can be divided into four quadrants, with some of the best-performing school divisions in the top-left quadrant of the graph (showing school divisions with below-average spending, and high SOLs) versus relatively under-performing school divisions in the bottom-right quadrant of the graph (with above-average spending, but low SOL pass rates).
Some further notable features of this mapping of nominal spending and educational performance in Virginia:
- The high-performing, low-spending quadrant prominently includes Virginia Beach, Chesapeake, and Prince William County.
- Conversely, the low-scoring, high-spending quadrant prominently features three cities: Roanoke, Richmond, and Alexandria.
- The low-spending, low-scoring quadrant prominently includes three suburban (or peri-urban) counties: Chesterfield, Spotsylvania, and Henrico Counties.
- The top-right quadrant, indicating high performance and high nominal spending, contains a number of Northern Virginia school divisions, including Fairfax County, Loudoun County, Arlington County, and Falls Church City. This quadrant predominantly contains lighter-colored bubbles—representing divisions that receive little financial support from the commonwealth.
- Conversely, darker bubbles—representing divisions that are more dependent on state and federal grants—tend to fall on the left side of the chart, with lower spending levels.
It is important to reiterate that lower SOL pass rates should not necessarily be equated to lower school division performance. For instance, all else equal (including equal per-student spending), school divisions that service a greater number of special-needs students—or more at-risk students or non-English learners—are likely to have lower SOL scores than school divisions that have fewer special-needs students or a more affluent student body.
A counterintuitive correlation
As noted above, the education spending and results data for Virginia school divisions suggests a negative relationship between per-student public education spending and average SOL pass rates. This finding seems counterintuitive—shouldn’t more spending lead to better outcomes?
Correlation, however, does not imply causation. The observed trend likely reflects Virginia’s commitment to equity under the SOQ framework: the state’s funding formula allocates more funding to divisions with higher concentrations of special needs students, economically disadvantaged learners, and non-English language learners. In other words, greater funding is directed toward school divisions where SOL scores tend to be lower, rather than greater funding being the cause of lower assessment scores. The negative correlation suggests that it is not easy for additional spending on public education to offset the obstacles being faced by students in school divisions serving higher-need student populations.
A deeper quantitative exploration of these relationships—distilling the determinants of school division performance while accounting for the impact of the socio-economic conditions of the communities they serve—is beyond the scope of the current analysis.
Accounting for local cost differences
One of the features that is often overlooked in the analysis of school performance is that Virginia’s school divisions operate in vastly different economic contexts. The cost of living in Northern Virginia, for example, is significantly higher than in other parts of the commonwealth. This means that the cost of attracting teachers in Northern Virginia is considerably higher as well. Nominal spending figures do not account for these disparities, potentially skewing comparisons.
To address this, the analysis ought to examine per-student spending on public education in real terms. Adjusting per-student spending on public education using a cost-of-locality index allows for a more accurate comparison of what each dollar actually buys in terms of educational services.
A shift in perspective: real spending versus nominal spending
Real per-student spending levels are revealed in the interactive graph by clicking the ‘play’ button.
Real per-student spending levels can also be viewed in a separate static graph (by using the toggle).
Expressing spending in real terms significantly shifts the analytical perspective. While the negative correlation between spending and SOL outcomes persists, the distribution of ‘bubbles’ in the scatterplot shifts quite drastically:
- Many Northern Virginia school divisions, which appeared as high-performing, high-spending jurisdictions in nominal terms, are revealed to be relatively high-performing and low-spending jurisdictions when expressed in real terms.
- Outside of the large jurisdictions in Northern Virginia, Virginia’s larger school divisions (typically urban or suburban jurisdictions) tend to have lower SOL pass rates when compared to other jurisdictions spending the same amount in real terms.
- Smaller—typically rural—school divisions in Virginia, many of which are highly grant-dependent, emerge as both reasonably high-performing and high-spending when adjusted for cost differences.
This reframing—by presenting spending patterns in real terms—underscores the importance of context in interpreting education spending data. What initially looked like high spending and potential inefficiency in nominal terms (for instance, the performance of Northern Virginia jurisdiction in the top-right-hand quadrant in nominal terms) is revealed to be higher spending necessitated by their high-cost environment.
To illustrate the more nuanced insights provided by cost-adjusting the public education spending data, consider Charlotte County and Richmond City. Despite similar real household income levels and similar levels of real per-student spending, Charlotte County significantly outperforms Richmond City in SOL pass rates. Yet Richmond City Public Schools receive a substantially smaller share of funding from intergovernmental revenues than Charlotte County.
While the current analysis does not resolve the cause of Richmond City Public Schools’ lower SOL results, a state public school system that wishes to improve equitable access to quality education has to direct greater attention and resources to jurisdictions where students are not achieving the desired Standards of Learning.
Key takeaways
- The ‘production function of education’ is multifaceted: Spending is just one variable among many, and standardized test scores only tell part of the story.
- Virginia’s funding model aims to move more funding to school division where spending needs are higher in nominal terms. This means that—counterintuitively—higher spending levels are generally correlated with lower student performance.
- By accounting for cost differences in different school divisions, the analysis of real spending levels provides a more accurate lens for evaluating the impact of public education spending on learning outcomes.
- Expressing spending in real terms significantly shifts the analytical perspective. For instance, rather than being considered higher-spending school divisions, many localities in Northern Virginia fall into the category of below-average per-student-spending (in real terms) after adjusting for cost differences.
- When expressed in real terms, smaller, rural school divisions in Virginia generally tend to perform better than their larger urban counterparts—yet, in many cases, intergovernmental fiscal transfers seem to favor smaller, rural school districts.
Implications for policy and practice
This analysis invites a more nuanced conversation about education funding in Virginia by recognizing that student performance is determined by a constellation of factors, making it difficult—if not impossible—to disentangle the impact of different drivers of learning outcomes.
As a result, local school leaders should be careful to make claims about the impact of greater public spending on education outcomes—or to overstate the threat that “under-funding” may pose to school quality. At the same time, claims about public school inefficiency or mismanagement are generally unsupported by solid evidence, as the production function of public education is complex and student performance on standardized tests is a poor measure of school quality.
Although further research is needed, the initial analysis suggest that the SOQ funding formula has not adequately taken into account the impact of cost-of-locality differences on local school performance. This has resulted in funding resources being directed toward low-cost school divisions that are performing quite well in terms of student outcomes, rather than directing these resources towards school divisions that are struggling to help their students achieve Virginia’s Standards of Learning.