

One of the most important public policy issues in Virginia is public education. Public schools in the Commonwealth educate over 1.25 millions every (school) day. As the primary pathway to opportunity, Virginia’s public education system shapes whether children from different parts of the Commonwealth—urban, rural, or suburban—can reach their potential and participate fully in society, or not.
In addition to its importance to Virginia families and children, public education should be critically important to its policy makers, as the Commonwealth’s long-term economic success depends on an educated, skilled workforce. Public education is Virginia’s single largest budget expenditure—both at the state and local levels–accounting for over 20 billion dollars in public spending each year. Yet, it appears that many people—including many policy makers and education leaders at the state and local level—are not really clear about how public education is funded in Virginia.
With this in mind, a series of three blog posts will provide an in-depth analysis of the public education funding formula in Virginia. Part 1 provides an introductory overview to public education funding in Virginia, and raises some concerns about the 2023 JLARC study as the policy vector for future reforms. Part 2 provides a deep-dive on the actual true costs of providing a quality education in Virginia within current fiscal constraints. Part 3 of the series asks ‘so what?’ and considers where next.
Why is an in-depth analysis of public education funding in Virginia needed?
The conventional wisdom in Virginia is that a revision of the public education finance formula in Virginia is overdue. Based on a report prepared by the General Assembly’s Joint Legislative Audit and Review Commission (or JLARC) in July 2023, the conventional wisdom further suggests that Virginia underfunds public education by billions. Whereas it is true that there is a need to update the Commonwealth’s public education finance formula in Virginia, as noted further below, the claim that Virginia underfunds public education by billions is largely unsupported by the evidence. Liek beauty, the optimal level of public education spending is in the eye of the beholder.
Nonetheless, the JLARC report is likely to play an important role in policy discussion in Virginia over the coming four years, as Virginia’s new Lieutenant Governor-elect is a major champion for public education finance reform. As a State Senator, she has already sought to implement several of the recommendations made by JLARC to reform Virginia’s Standards of Quality (SOQ) school funding formula. But, as I will argue below, the JLARC study only weakly adhered to the directions provided by the General Assembly, and its analysis and recommendations suffer from a number of shortcomings.
In addition, a solid understanding of public education funding is required to prevent conflict between local governments and their school boards. For instance, to the extent that the SOQ formula underfunds certain school divisions, educations officials may erroneously blame county officials for their fiscal challenges, while the real culprit may be the Commonwealth.
Since I have analyzed and developed grant allocation formulas in countries around the world for the past 25 years, I have some unique insights on how these types of transfer systems work, both in theory as well as in practice.
It is unlikely that a statewide “tax and spend” approach to public education will improve the efficiency and equity of public education in Virginia. Yet, in many ways, that is what the JLARC recommendations suggest: its full recommendations imply a 4.4 billion dollars increase in the state SOQ obligation. In doing so, the JLARC report also largely ignores the distributional impacts and political economy aspects of the different allocation mechanisms. For instance, Fairfax County taxpayers contribute roughly $2.5 billion more to the state budget than they get back–almost 6,000 dollars per household). Yet, the current public education formula shortchanges Fairfax County by roughly 350 million dollars per year, resulting in higher property taxes and lower teacher salaries.
By unpacking the numbers and the policy choices behind Virginia public education funding formula, my goal is to shed light on what is really driving the problems with public education funding in the state—and what issues need to be considered in arriving at a more objective, efficient and equitable system of funding to ensure that all children in Virginia have access to a quality public education in the Commonwealth.
An introduction to K–12 funding in Virginia
Virginia’s K–12 public education system is jointly funded by the state and local governments under a framework known as the Standards of Quality (SOQ). Mandated by the Virginia Constitution, the SOQ formula is the central mechanism that determines how much each school division should receive from the Commonwealth—and how much it must raise locally.
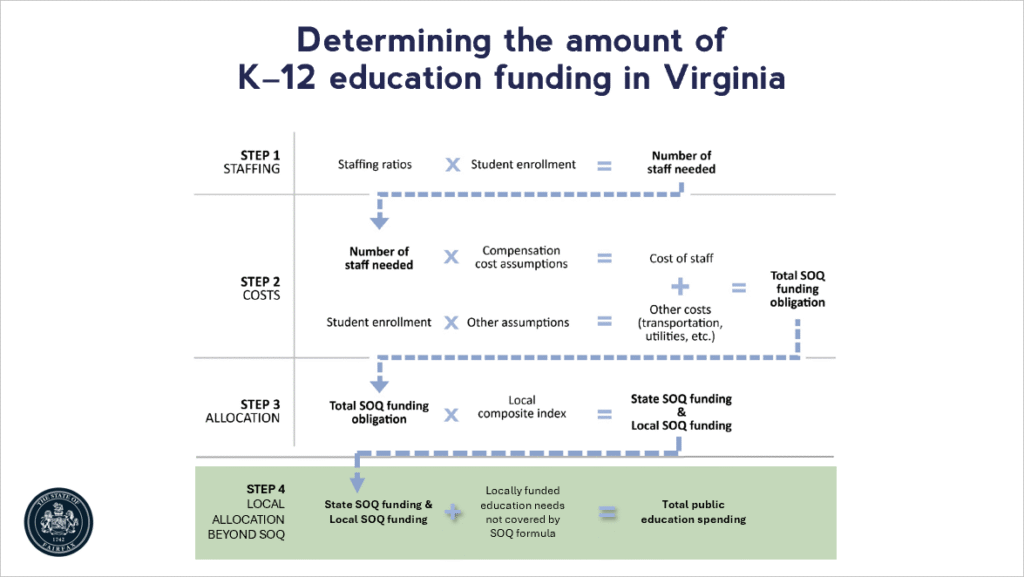
Under the Constitution of Virginia, the General Assembly “shall determine the manner in which funds are to be provided for the cost of maintaining an educational program meeting the prescribed standards of quality, and shall provide for the apportionment of the cost of such program between the Commonwealth and the local units of government comprising such school divisions”. To operationalize this, the Virginia Department of Education uses a multi-step SOQ funding formula based on enrollment, staffing standards, and local fiscal capacity. Somewhat confusingly, the terms SOQ is applied both to the physical norms (i.e., the required student-teacher ratio) as well as to the financial norms that result from the formula process:
Step 1: Establish Standards of Quality. The Board of Education defines minimum staffing levels, programs, and support services needed to provide a high-quality education—such as teacher–student ratios, guidance counselors per pupil, or administrative support norms.
Step 2: Estimate the Statewide Cost. The Department of Education multiplies these staffing and program requirements by prevailing cost norms—the average salaries, benefit rates, and other operating expenses observed across school divisions. This yields the estimated cost of delivering the SOQ statewide.
Step 3: Determine State and Local Shares. In aggregate, as a matter of policy, local governments are expected to contribute 45 percent of the resources required to provide a quality public education, whereas the state government contributes roughly 55 percent. However, the share that each locality is expected to contribute depends on its “ability to pay”. Each locality’s Local Composite Index (LCI) measures its “ability to pay” using a weighted average of local property values, adjusted gross income, and taxable sales. The LCI determines the percentage of the SOQ cost that each locality must fund from its own resources—typically between 20% and 80%.
Unofficial Step 4: Local Allocation Beyond SOQ. In practice, the norms that are used by the commonwealth to determine the cost of a “quality education” are based on outdated assumptions and exclude many real expenses. As a result, the SOQ formula substantially underestimates the true funding level required to provide a quality education. Localities therefore consistently spend more than the total SOQ funding obligation, which is the total of the State’s SOQ grant amount plus the Local SOQ obligation. According to JLARC, local spending on public education–from own source revenues—exceeds their Local SOQ obligation by more than $6 billion each year in order to sustain actual operations.
The overview of the SOQ formula provided above–how the Commonwealth determines the expenditure requirements for a quality public education in each school division–highlights the main features of the allocation process, while skipping some of the nitty-gritty details of the formula. While the details of the allocation formula–such as the exact manner in which the Local Composite Index is computed–can have a considerable impact on the allocation of resources for individual school divisions, the primary aim of the current analysis is to assess the suitability of the SOQ approach overall, including the gap between current SOQ requirements and the cost of public education based on the actual expense of education prevailing in the Commonwealth. Fortunately, for once, the devil is not in the details.
Does the “state SOQ formula yield substantially less funding compared to actual practice and benchmarks”?
As noted above, many policy makers point to JLARC’s 2023 analysis of Virginia’s K–12 Funding Formula as solid policy guidance on how to reform Virginia’s public education funding mechanism. Its policy recommendations are based on a prominent claim made by the JLARC report, which is that the “state SOQ formula yields substantially less funding compared to actual practice and benchmarks.” Yet, while the first part of that statement is completely true (“”state SOQ formula yields substantially less funding compared to actual practice”), the second part of that statement (“the state SOQ formula yields substantially less funding compared to other benchmarks”) is much more ambiguous.
The state SOQ formula yields substantially less funding compared to actual practice. JLARC report recognizes that for Fiscal Year 2021, “the SOQ formula calculated school divisions needed a total of $10.7 billion in funding, but divisions actually spent $17.3 billion on K–12 operations, meaning the formula provided $6.6 billion less than what was spent (a 38 percent difference)… The vast majority of the additional funding for school divisions comes from local governments.”
While the JLARC report identifies the gap between the SOQ obligation and actual funding levels as a major challenge with the current SOQ formula, its further analyses and recommendations do not actually confront this challenge. For instance, when it comes to “estimat[ing] the cost of implementing the Standards of Quality based on the actual expense of education prevailing in the Commonwealth“–as per its mandate from the General Assembly–the Commission’s report strictly focuses on the current baseline level of SOQ funding, without taking into account that the additional $6.6 billion of local spending should have been considered as part of “the actual expense of education prevailing in the Commonwealth”.
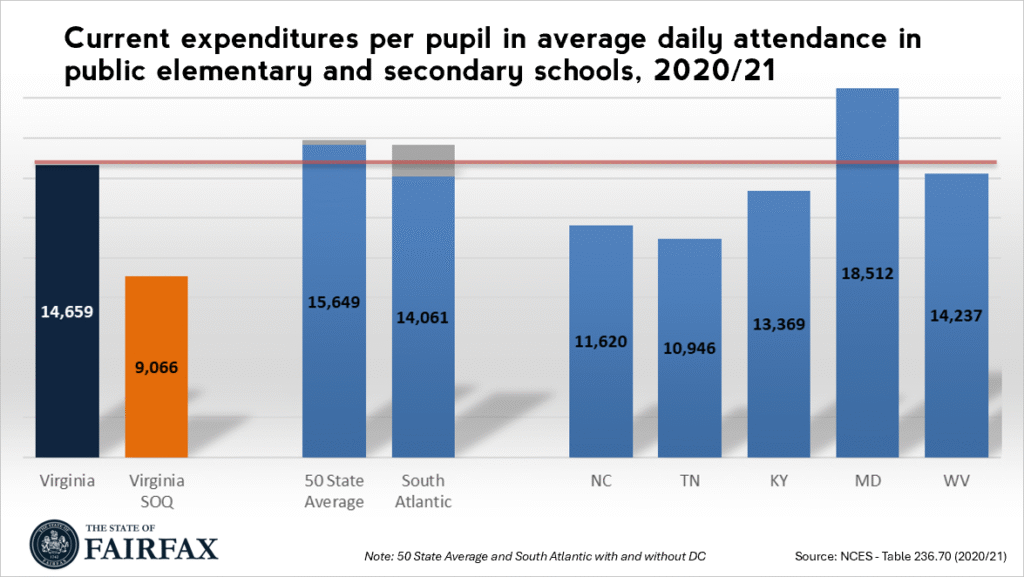
Does the state SOQ formula yields substantially less funding compared to other benchmarks? The opening statement in JLARC’s report is that “Virginia school divisions receive less K–12 funding per student than the 50-state average, the regional average, and three of Virginia’s five bordering states.” Unfortunately, when taken by itself, this statement is misleading and untrue: in aggregate, Virginia school divisions actually do not receive less funding per student than most neighboring states, nor does Virginia spend less than the state average in the South Atlantic region. Statewide, Virginia’s public education spending is more or less on par with (or higher than) these comparators, with the exception of the State of Maryland (see figure below). The real gap–as noted above, and visually represented below–is between the actual level of public education spending per student in Virginia and the artificially-low spending requirement based on the state-determined SOQ norms.
JLARC’s claim that “Virginia divisions receive less funding per student than other states” only becomes true (or true-ish) when taking into account the footnote that clarifies that the table presents “funding per student adjusted for cost of labor.” It is very difficult, however, to objectively determine the cost of labor in different states, especially as the cost of labor is closely correlated with the quality of labor. In addition, the cost of labor varies considerably not only between–but also within–states, as a result of variations in the cost of living within and across states. In addition, there is a complex interaction between the cost of labor and state funding formulas (as discussed further below). These concerns render the comparative analysis of “funding per student adjusted for cost of labor” with limited value as a policy benchmark.
JLARC did not fully explore the “true cost of education in the Commonwealth”. JLARC’s report provides a rather cursory, aggregate analysis of the “true cost of education in the Commonwealth … based on the actual expense of education prevailing in the Commonwealth”. At the most basic level, as state and local spending on public education in Virginia (excluding federal aid) is approximately 18.9 billion dollars (FY24), and Virginia public schools serve 1.25 million students, then the “true cost” faced by schools in educating Virginia’s children is close to 15,000 dollars per student.
In its analyses and simulations, however, JLARC focuses more narrowly on the spending directly tied to the state-set service delivery norms. Because of this perspective, it ignores that the “true cost” of public education includes the additional 6.6 billion dollars that local governments spend on public education each year (beyond what is required by the SOQ norms). Within this limitation, JLARC’s baseline of “true costs” for providing a quality education starts at roughly 9,000 dollars, based on current state-approved physical service delivery norms, rather than the “true cost” faced by schools of 15,000 dollars per student (as noted above). Subsequently, the JLARC report pursues over a dozen policy recommendations that focus on increasing the state’s contribution to the SOQ mechanism as a way to increase total public education spending in Virginia, downplaying the role of local contributions to public education funding.
A more in-depth analysis on actual spending level would be extremely instructive in understanding how the SOQ formula could actually be improved, resulting in a more objective, efficient, and equitable allocation of public education resources in Virginia. An analysis of the true cost of implementing Standards of Quality based on the actual expense of education prevailing in the Commonwealth would further provide major insights into the fundamental political economy challenges that need to be faced in order to successfully reform Virginia’s system of public education funding.
Exploring the difference between SOQ requirements and actual spending
A very first starting point in analyzing the gap between the current SOQ norms and the “true cost” of public education in Virginia would have been to explore the differences between the current SOQ requirements and and actual public education spending levels. This is done in the three graphs below, showing (a) the total SOQ expenditure obligation per student, as per the current SOQ process–meaning, the amount of spending that the Commonwealth claims is “the cost of maintaining an educational program meeting the prescribed standards of quality”, as per the Virginia Constitution; (b) actual public education spending levels per student; and (c) the difference between the two.
There are a number of reasons for there to be differences between the SOQ spending requirement and actual expenditures. First, given the fact that there is no such thing as a perfect formula to determine public education spending needs in each school division, we would expect some differences to exist between actual spending needs and estimated need. For instance, it is not unusual for formula-based allocations not to effectively cater for outliers (such as extremely remote localities, islands, etc.). Second, different school divisions may have different preferences for public education quality and for local taxation. To the extent that wealthier and better-educated parents may value education more, they might be willing to pay more in local taxes to provide more funding to the local school system.
Third, the maps below suggest that current SOQ norms are consistently lower than actual public education spending. This is true not only for the average, but across all local school divisions in the Commonwealth–thus clearly confirming that the SOQ standards are systematically set too low across the board. (Note that when a zero difference is reported on the map, this is due to the failure of the local government to report its spending to the Virginia Auditor of Public Accounts).
Fourth, the third map clearly shows that the level of underfunding is not evenly spread across the Commonwealth: some localities or region in the Commonwealth are underfunded by a lot more than others (compared to actual spending levels). There is a clear pattern to the degree of underfunding of the SOQ formula, which especially impacts school divisions in Northern Virginia, home to 30 percent of the state’s population. As confirmed in Part 2 of the analysis, the variations in the gap between the SOQ norm and actual spending are not (just) due to differences in preferences, but due to a systematic bias in the SOQ allocation formula.
Full-size map: Actual public education spending per student, FY 2024
Full-size map: Public education (SOQ) funding requirement per student, FY 2023
Full-size map: Difference between actual public education spending and SOQ funding requirement per student