

This is Part 2 in a three-part series providing an in-depth analysis of the public education funding formula in Virginia. (Start at Part 1 or skip to Part 3).
Context for Part 2
In 2021, Virginia’s General Assembly recognized that its so-called Standards of Quality funding formula–the funding formula used to fund quality education in Virginia–no longer reflected the actual costs schools face in educating Virginia’s children. As such, it directed its own research body–the Joint Legislative Audit and Review Commission–“to study the true cost of education in the Commonwealth and provide an accurate assessment of the costs to implement the Standards of Quality”. In conducting its study, JLARC was directed to “estimate the cost of implementing the Standards of Quality based on the actual expense of education prevailing in the Commonwealth”. Unfortunately, JLARC’s report interpreted its mandate rather narrowly by estimating the cost of the state-approved staff ratios and physical service delivery standards, rather than looking at the total (state and local) expenditures made in pursuit of public education in Virginia.
A more in-depth analysis on actual spending level would be instructive in understanding how the SOQ formula could actually be improved, resulting in a more objective, efficient, and equitable allocation of public education resources in Virginia. An analysis of the true cost of implementing Standards of Quality based on the actual expense of education prevailing in the Commonwealth would further provide major insights into the fundamental political economy challenges that need to be faced in order to successfully reform Virginia’s system of public education funding.
As such, Part 2 of this analysis of the public education funding formula in Virginia computes the true cost of public education in the Commonwealth based on expenditure norms that are based on the actual level of public education spending in Virginia per student. Similarly, the analysis determined the actually ability of local governments to pay for public education in Virginia based on the actual level of local revenues spent on public education spending in the Commonwealth. As appropriate, comparisons are made between these “true cost” estimates and a number of different comparators, including (i) current SOQ norms, (ii) actual public education spending levels, and (iii) the recommended SOQ norms, as per JLARC’s recommendations.
The true cost of public education in the Commonwealth
As a conceptual point of departure, the actual level of public education spending in Virginia (for instance, per student) is a superior approach to estimating the “true cost of public education in the Commonwealth” when compared the current SOQ approach. A strong argument can be made that a financial norm-based approach that relies on actual public education spending levels is a more credible approach in determining the true cost of public education in the Commonwealth compared to an approach that assigns subjective ‘costs’ to state-determined service delivery norms, especially since both the state-determined physical norms as well as the assumptions underlying the costing-standards have degraded over time to reflect state-level resource constraints and state-level policy preference (or biases, as the case may be).
For clarity, it is helpful to start the exposition of the “true cost” of public education based on the simplest approach (a single per-student financial norm), and then to add greater complexity to the methodology to arrive at a more nuanced set of norms that capture the ‘true cost’ of public education in the Commonwealth. In order to illustrate the impact of each step along the way, numerical simulations will be prepared of each interim step along the way. As a caveat, it is important to note that there is no such thing as a perfectly objective formula: virtually every technical decision made in the development of an allocation formula has distributional implications.
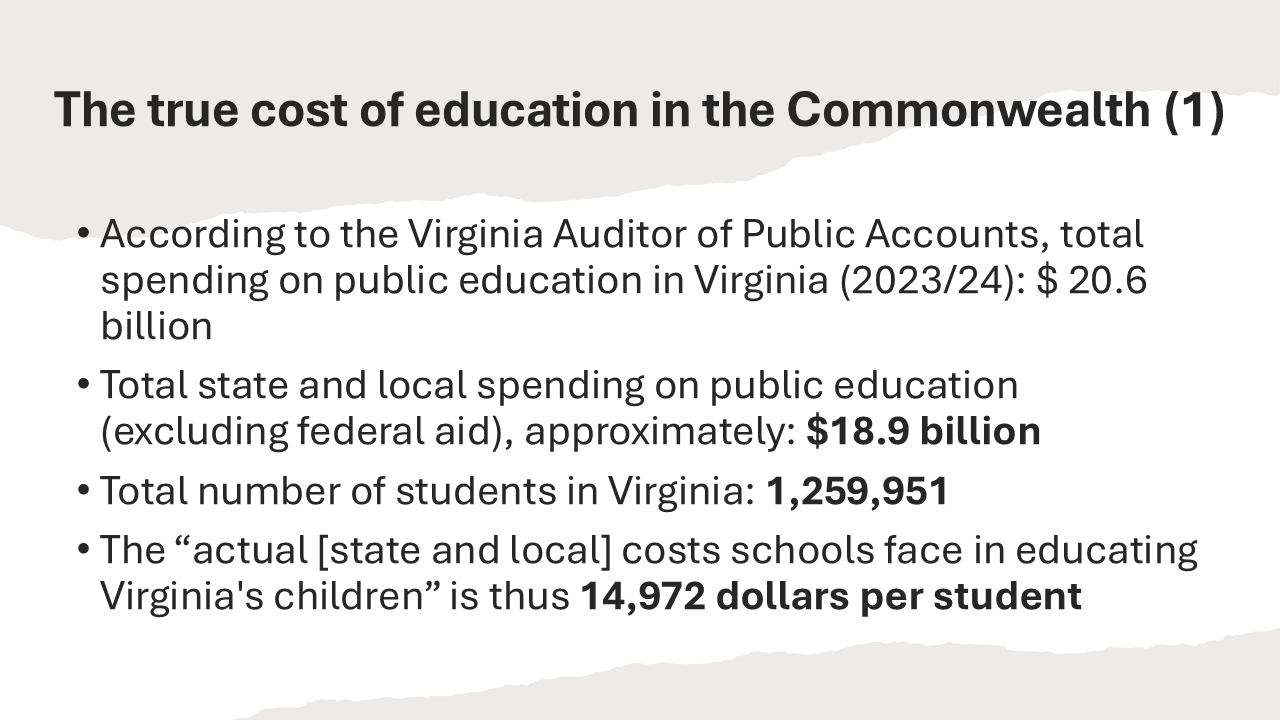
Step 1: Expressing the true cost of a quality education in Virginia as a single financial norm. A true-cost analysis begins not with assumptions but with actual audited data. According to the Virginia Auditor of Public Accounts, combined state and local spending on public education in FY 2023–24 totaled about $18.9 billion for 1.26 million students, or roughly $14,972 per student. Of course, the total cost for each county or city would have to determined by multiplying this expenditure norm ($14,972 per student) with the (FTE) number of enrolled K-12 students.
As already noted in Part 1, this per-student norm could be considered the simplest expression of the “true cost” of a public education in Virginia, as it reflects the actual average level of resources spent per Virginia K-12 student. Although this approach does not provide for any variation in per-student expenditure needs across localities, for completeness, the map below (which can be opened by clicking the toggle) reveals the simplest “true-cost” estimate of the cost of a quality education in Virginia.
Map. The estimated “true cost” of a quality education in Virginia as a single financial norm
Of course, in practice, the true cost of education is not the same everywhere in the Commonwealth. Each locality faces its own unique combination of needs and challenges that influence what it actually costs to deliver a high-quality public education. Some divisions must invest more heavily in special education programs to serve higher proportions of students with disabilities, while others face larger populations of students at risk of poverty who require additional instructional support, nutrition programs, and social services. In other locations, particularly those with many English learners, the cost of education rises due to the need for specialized teachers, language programs, and smaller class sizes.
Step 2: Expressing the true cost of a quality education in Virginia as a set of disaggregated financial norms. The differences noted above mean that the “true cost” of providing an equitable education cannot be captured by a single statewide spending norm. Instead, costs vary systematically across Virginia’s diverse school divisions—reflecting demographic and socio-economic factors that shape how resources must be allocated to ensure every child, regardless of where they live, has a fair opportunity to succeed.
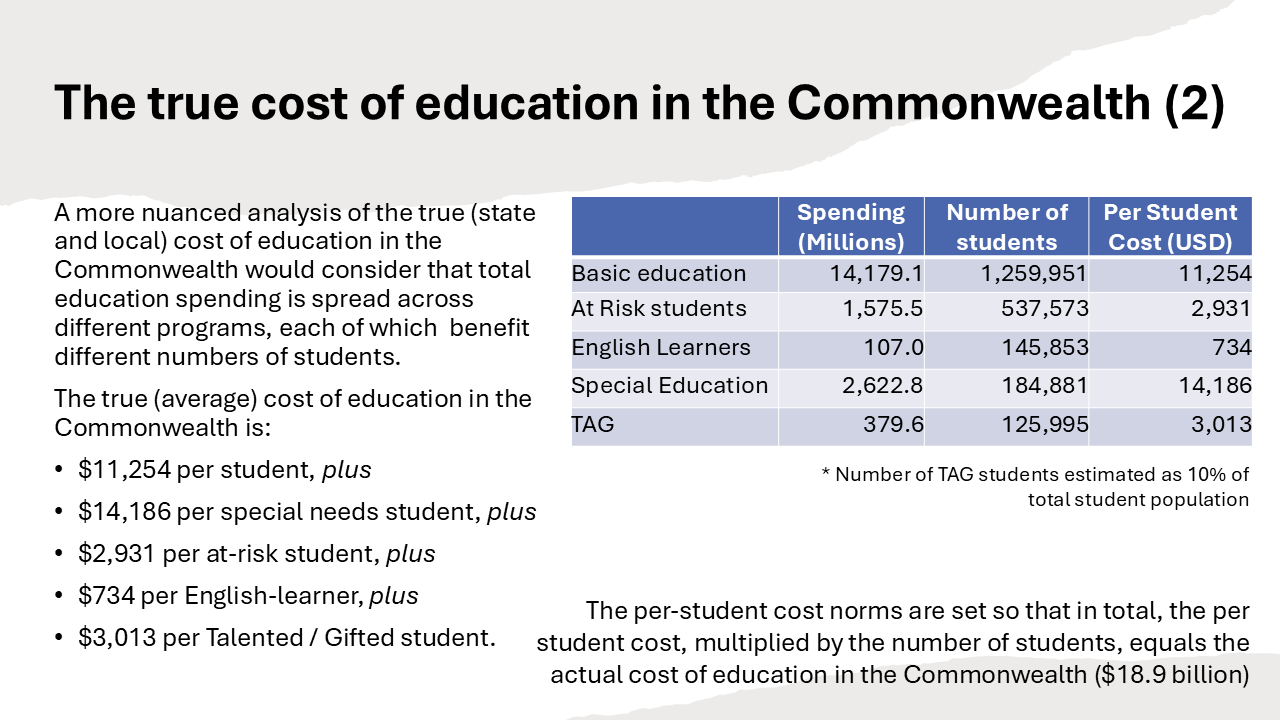
When actual public education spending is disaggregated by program, it reveals distinct programmatic cost patterns. For instance, while the expenditure need for general education is $11,254 per student overall, schools in Virginia on average spend an additional 14,186 dollars per special-needs student, along with and additional 2,931 dollars per at-risk student, 734 dollars per English-learner, and 3,013 dollars per gifted or talented (TAG) student. These program-specific spending norms, grounded in real expenditure data, provide a more accurate benchmark for what Virginia’s school divisions actually spend to provide a quality education to their students.
The net result of this more nuanced formula is that the estimated “true cost” of a quality education in Virginia is no longer the same everywhere: instead, the estimated cost of a quality education in the locality facing the lowest needs (Lexington City) is, on average, 13,721 dollars per-student, whereas the locality facing the highest needs (Craig County) requires on average of 16,547 dollars per-student to fund the same quality of education based on its different programmatic needs. Places that have systematically higher needs–especially a larger share of students at-risk–receive a higher per-student allocation as resource needs are determined on the basis of program-specific financial norms.
Map. The estimated “true cost” of a quality education in Virginia based on program-specific financial norms
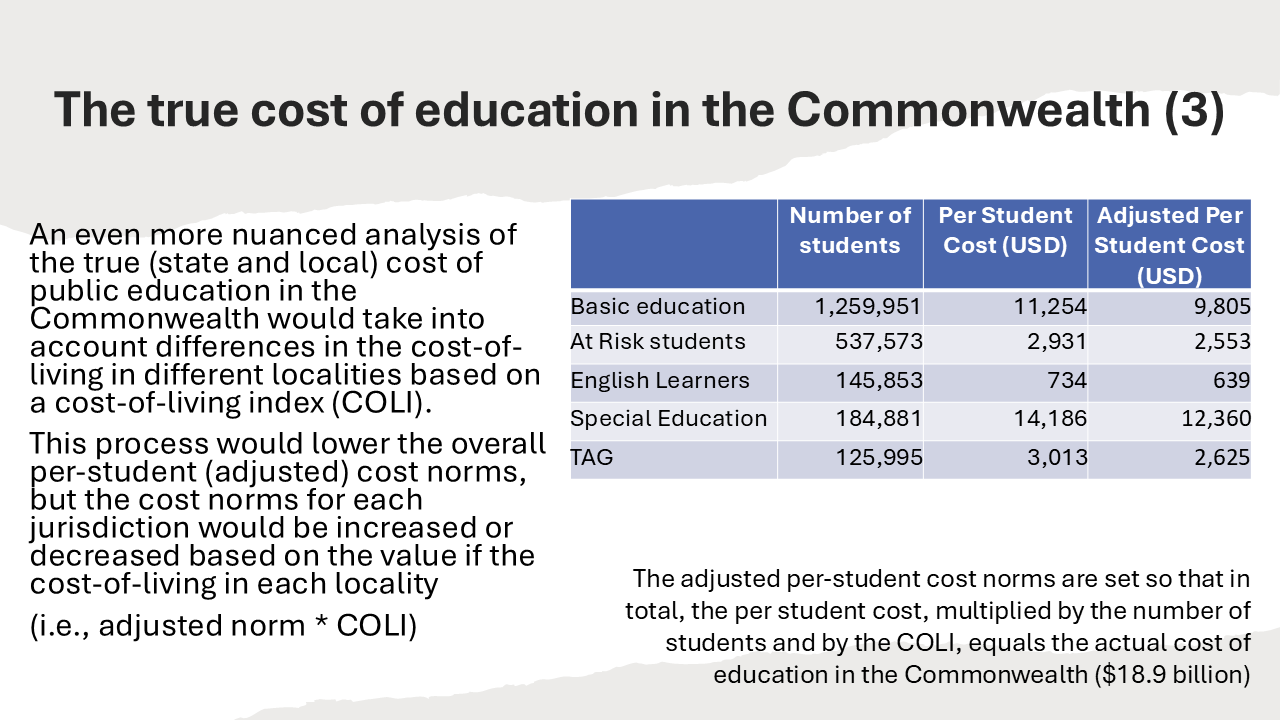
Step 3: Taking into account programs norms as well as cost-of-locality variations. In addition to recognizing the impact of demographic and socio-economic variations on different educational programs across different school divisions, it is important that public education benchmarks also recognize differences in the cost of living across different localities, so that resources can be distributed efficiently and equitably in real terms (rather than in nominal terms).
After all, as noted in a previous blog post, when it comes to evaluating teacher compensation, numbers can be deceiving: a salary of $70,000 in one Virginia school division might seem generous—until you realize that in another locality, the same amount barely covers rent. The current SOQ formula takes into account cost (wage) differentials between different localities in a process known as the Cost-of-Competing Adjustment (COCA).
In the context of the current SOQ standards (which are rooted in staffing norms and physical input norms- see Part 1), JLARC’s 2023 study recognized that “[a]n effective education funding formula should also account for higher labor costs. Virginia’s SOQ formula attempts to account for higher labor costs in some divisions through the cost of competing adjustment, which provides varying funding increases to divisions in and around Northern Virginia. The cost of competing adjustment provides less additional funding than actual salary differences. For example, Arlington County Public Schools receives a 9.83 percent adjustment for teachers’ salaries but its actual labor costs are 40 percent more than the average Virginia school division’s labor cost.” (JLARC 2023: p. v). The misalignment in the current SOQ formula, which has permitted in a considerable divergence between the “cost of competing adjustment” and actual wage cost differences, means that high-cost jurisdictions must shoulder a disproportionate share of the real cost of education, often through higher local tax rates and through lower teacher wages. As a result, JLARC recommended replacing the Cost of Competing Adjustment with a “newer, more accurate method”. However, it suggests that this recommendation should be implemented in the long term, “to be phased in by the FY33–34 biennia, if funding is available”.
This misalignment, however, is not an accident; it is a symptom of an underlying political economy bias. In fact, the lack of urgency displayed by JLARC in correcting this issue likely reflects this political economy reality. Whereas Virginia policy makers are willing to offset higher expenditure requirements when it comes to certain educational needs (such as special needs education, at-risk students, and so on), they are clearly much less willing to offset the higher expenditure needs of high-cost urban areas. (This pattern holds not just in Virginia, but across the U.S., and even around the world.) This predisposition may be due to the perception–often shared by the public and policy makers alike–that high-cost localities are often also high-income localities, and thus, that these localities do not need to be compensated for their higher expenditure needs. This logic would be correct if it weren’t for the fact that the SOQ formula already takes into account the higher ability-to-pay through the Local Composite Index (LCI). Alternatively, this bias in the SOQ formula may also be the result of a simple political calculation: while a majority of localities (and their political representatives) benefits from adjusting the formula on the basis of poverty or or other broad-based needs, only a handful of local jurisdictions benefit from an cost-of-locality adjustment. In simple terms: not adjusting for cost differentials is a politically convenient way to keep the (official) cost of public education low, while placing an additional burden on high-cost localities by requiring higher local taxes and causing lower (real) teacher salaries.
In fact, even if the SOQ formula would be modified to fully adjust for current wage differentials, this adjustment would fall short from treating higher-cost jurisdictions fairly. After all, differences in prevailing wage rates for teachers are heavily influenced by the current (biased) SOQ formula. If Arlington wouldn’t be grossly underfunded by the current SOQ formula, it could pay its teachers better. Similarly, if the allocation formula wouldn’t be systematically generous to low-cost rural jurisdictions by assuming a generous wage rate, the prevailing wage rate for teachers in these localities would likely drop considerably (quite possibly, along with the quality of public education in these jurisdictions). Short of adjusting the local expenditure requirements to reflect the full impact of cost-of-living differences in different localities, state officials would be making (the rather arbitrary, but politically expedient) policy decision that teachers in high-cost localities do not deserve to be compensated equally in real terms when compared to teachers in lower-cost jurisdictions.
Although reliable county-level cost-of-living data is generally unavailable from official data sources (thus making it difficult for policy makers to account for this in a formula), a true-cost funding framework would explicitly incorporate a cost-of-locality index into the calculation of expenditure requirements. For computation purposes, is is possible to use the EPI Family Budget Calculator to construct a Virginia Cost of Living Index (as further explained here). Assuming that local price differences only impact labor costs, the index is applied to 85 percent of education spending (rather than to 100 percent). This approach–which adjusts not only for differences in the demand for different educational programs (special ed, at-risk, etc.), but also adjusts for differences in the cost of living, could be used to replace outdated, politicized cost assumptions with evidence-based norms, producing a more transparent and equitable picture of what it truly costs to provide high-quality public education across Virginia. In doing so, it would allow policymakers to align resources with reality—and ensure that every child in the Commonwealth, regardless of where they live, has access to the same standard of educational opportunity.
What does the distribution of SOQ spending requirements based on the “true cost” of a quality public education look like?
Based on “true cost” SOQ methodology described above–using per-student financial standards that account for differences in public education needs across the Commonwealth in response to socio-economic and programmatic differences as well as differences in local cost levels–the map below shows the spending requirement (per student) for public education for each school division in Virginia.
Given that this approach is based on aggregate actual spending levels (minus federal grants) and “estimates the cost of implementing the Standards of Quality based on the actual expense of education prevailing in the Commonwealth”, this methodology does not permit the systematic underfunding of SOQ norms as is currently the case. And as noted above, this approach would replace outdated, politicized cost assumptions with evidence-based financial norms, producing a more transparent and equitable picture of what it truly costs schools to provide a quality public education across Virginia.
When compared to the earlier “Step 2” map–which relies on program-specific norms, but does not adjust for cost-of-living differences–one thing is instantly clear: the true impact of cost-of-living differences on public education costs is much bigger that the impact of programmatic differences. Whereas the earlier map shows that Southwest Virginia (and to some extent, other areas in Central Virginia and Southside) have higher expenditure needs, the map that accounts for both programmatic and cost-of-living variations clearly shows overall higher expenditure needs in Northern and Eastern Virginia.
For comparison, the smaller map below (on the left) repeats the earlier map from Part 1, revealing the current (underfunded and politicized) SOQ funding requirements. The smaller map below on the right shows a direct comparisons of the “true cost” SOQ norms and the current (excessively low) SOQ obligation levels, with darker blue localities being localities that are relatively being disadvantaged by the current SOQ formula (compared to the simulated financial norms).
These maps clearly confirm two patterns. First, they suggests that the “true cost” SOQ norms would be beneficial to all but a handful of school divisions in Virginia, as the “true cost” SOQ norm exceeds the current SOQ funding norm for almost every school division in the Commonwealth (as a result, the second map is almost exclusively blue). Second, the comparative map (on the right) suggest that the current SOQ formula systematically underestimates funding requirements in some parts of the Commonwealth more than others. In particular, the map suggests that the higher public expenditure requirements of higher-cost localities are generally not reflected in the current SOQ formula. As a result, the current SOQ formula does a reasonable job estimating the cost of public education in Southside Virginia, but systematically underestimates the public education requirements (by thousands of dollars per student) for school divisions generally located in the triangle from Loudoun County to Albemarle County to Virginia Beach.
It is good news that if one were to estimate the cost of implementing Standards of Quality based on the actual expense of education prevailing in the Commonwealth (as opposed to the excessively low norms currently used), virtually all school divisions in Virginia would be “winners”. The conclusions above are also consistent with an earlier analysis of public education performance and public education expenditures (in real terms) in Virginia that indicated that smaller, rural school divisions in Virginia currently appear to be (relatively) overfunded. Adopting a more objective resource allocation approach would thus fund public education more fairly, resulting in a more equitable allocation of resources and a more uniform standard of quality across the Commonwealth.
However, the distribution of public resources for public education is ultimately not a technical decision, but rather, a political one. For instance, if we consider the recommendations put forth by JLARC–the General Assembly’s own policy analysis group–and compare it to the objective metric of public education requirements developed here (as is done in the toggle map below)–we note that JLARC’s recommendations fail to resolve the biases that exist in the current SOQ formula. Although JLARC’s recommendations may partially address some of the shortcomings–such as inadequate cost adjustments–the simulations of their own SOQ recommendations continue to show the same distributional biases that are present in the current SOQ formula. In other words, while the recommendations by JLARC result in greater state spending on public education, the recommended reforms to the SOQ formula do not necessarily improve the relative distortions of need that plague the current formula.
And even if adopted, the impact of these more objective and more realistic norms will depend on how the funding of these norms will be divided between the state government and the local governments.
Full-size map: Difference between JLARC funding recommendation and “true cost” funding requirement
The true ability of localities to contribute to the cost of public education in the Commonwealth
Beyond the computation of public education expenditure requirements themselves, it is well-known among school officials in Northern Virginia that they are expected to pay a much larger share of public education expenditures than other school divisions. For instance, whereas Fairfax County is expected to fund 65% of its SOQ norm based on the current Local Composite Index (LCI) computation, other school divisions are expected to pay less than 20%. What is not commonly understood is that this is not necessarily a problem with the computation of the LCI itself, but rather, that the real imbalance is caused by the way in which the LCI is applied.
Indeed, the important secondary impact of the Commonwealth current SOQ approach–which sets SOQ standards excessively low–is the fact that when using the current approach to dividing the total SOQ obligation between the state and local levels, the local obligation for funding public education is also set excessively low. At the same time, an additional funding burden is imposed on numerous school divisions–especially high-cost school divisions that are ill-served by the current formula–as they are required to generate considerable additional funds from own source revenues to fund their educational needs. While high-cost jurisdictions have to raise considerably more revenue–far above the local SOQ obligation based on the current (excessively low) SOQ norms–to provide a quality public education, low-cost local school divisions in other parts of the state might decide to only raise a little additional local funding.
In the case of Fairfax County, instead of merely funding its local SOQ obligation from own source revenues (which would equal 65 percent of 10,946 dollars per student), in order to ensure an adequate level of educational quality, FCPS actually contributes a much greater amount of its total public education spending from own sources: 66.7 percent of 19,855 dollars per student. In other words: the “low-balling” of SOQ norms–in combination with the formula’s bias in favor of local-cost localities–has an especially negative impact on higher-cost school divisions that are already treated unfairly by the existing SOQ formula.
In order to ensure that every school division in Virginia contributes objectively according to its true ability to pay, a different approach could be followed to determined each school division’s ability to pay. This approach, known as the Representative Revenue System, was developed by the erstwhile U.S. Advisory Commission on Intergovernmental Relations (US ACIR). Much like the “true cost” approach with which educational spending needs were determined, this approach is based on the actual (aggregate) amount of education spending that is funded by local own source revenues (OSR) in the Commonwealth. Following this approach, the local ability to pay (or revenue potential) for public education is determined in three steps:
- First, much like the current Local Composite Index, the local-ability-to-pay considers the actual local revenue bases in each locality, by separately considering (i) the market value of real estate; (ii) the level of taxable retail sales; and (iii) the adjusted gross income in each locality.
- Second, given that the total level of local revenue collections is know by source (from the Virginia Auditor of Public Accounts), it is possible to compute the average effective tax rate (AETR) for each of the three main revenues categories by dividing each revenue stream by its tax base. For instance, the average effective property tax rate in Virginia can be determined as 0.0119 (or 1.19 percent) by dividing the total amount of property tax revenue collected in the state ($19,104,286,523) by the aggregate total market value of taxable property ($1,606,769,592,068).
- A final adjustment needs to be made, however, since not all local revenues in Virginia are available to be spent on public education. According to the Virginia Auditor of Public Accounts, local governments spent (in aggregated) 9.8 billion dollars on public education from own revenues, out of a total of 29.1 billion raised in own local revenues in FY 2024. Therefore, the local ability to pay from each revenue source is adjusted based on this ratio (0.3386) to arrive at each locality’s total “true” local ability to pay for public education.
Unlike the current SOQ/LCI approach, there is no need to multiply the ability-to-pay amount by the expenditure requirement. Instead, the local ability pay represents the actual dollar amount that each locality would be able to generate for local public education if it were to apply an average effective tax rate to each of its respective tax bases.
In turn, the state’s SOQ funding obligation is simply be determined as the difference between the total SOQ requirement and the local ability to pay. Each local governments revenue potential–or its local ability to contribute to public education, if it were to apply an average effective tax rate to its local tax bases–is presented in the map below. Please note that whereas the previous maps presented figures in per-student amounts, the ability-to-pay is presented in per capita (per person) terms.
How does the current local SOQ funding obligation compare with the local ability to pay and actual local funding contributions?
How does the current local SOQ funding obligation compare with the local ability to pay? And how does the local ability to pay compare to actual local funding contributions, or to the local contributions expected under JLARC’s recommended SOQ arrangements?
First, because the local SOQ obligation is based on expenditure norms that are purposely set too low, the current expectation of local funding is also extremely low. As show by the map below (on the left), for most localities, the current local SOQ funding obligation is only 30-60 percent on the localities’ actual ability to pay–where the actual ability to pay is determined objectively by each locality’s actual revenue bases and by the actual average effective tax rate. In other words, general expectation that local governments should contribute to their own public education needs based on their actual abliity-to-pay is completely distorted.
Second, comparing actual local revenue contributions compared to each locality’s ability to pay (as shown by the second of the three maps below) reveals a familiar pattern: whereas most rural localities much of the state contributes less own-source revenue to public education than suggested by their ability-to-pay, better-off and more urban jurisdictions in Northern, Central and Eastern Virginia actually contribute more to public education than indicated by their ability-to-pay. In total, in practice, 87 local school divisions contribute less to public education than their actual ability to pay, as computed based on the Representative Revenue System (as described above). In aggregate, these local governments contribute 881 million dollars less to public education in their own local jurisdictions than their objective ability to pay, while receiving considerable intergovernmental fiscal transfers from the commonwealth. At the same time, the 20 local school divisions that spend more than their objective ability to pay collectively contribute an 1,258 million dollars more than what would be their SOQ local contribution. In other words, the state SOQ grants are not funding better public education in rural Virginia: they are funding local tax cuts.
Third, would the full recommendations put forth by JLARC fix this situation? The third map below suggests the answer is no. Whereas the recommended modifications to the SOQ formula made by JLARC would increase the overall SOQ standards–and therefore, the expected local contributions–some of the imbalance would persist. Under JLARC’s recommendations, 46 local school divisions would contribute less to public education than their actual ability to pay, as computed based on the Representative Revenue System, contributing–in aggregate–197 million dollars less to public education each year than their objective ability to pay. In other words, JLARC’s recommendations would continue to rely on intergovernmental redistribution through state SOQ grants, while at the same time permitting many local governments to contribute less to local public education than their ability-to-pay.
Full-size map: Current Local SOQ obligation (as share of actual local ability to pay for public education)
Full-size map: Actual public education spending funded from own revenues (as share of actual local ability to pay for public education)
Full-size map: Local SOQ obligation based on JLARC recommendations (as share of actual local ability to pay for public education)
Continue to Part 3 …
Caveat (added November 20, 2025): The simulations made for this blog series use official data for the computations. However, simulations and comparisons do not take into account all the nuances of the current grant allocation process. For instance, the simulations do not take into account the distribution of grant resources earmarked for transportation of school meals programs. The modeling of such nuances require time and resources beyond what is currently available based on volunteer effort alone.