
For years, the Rockefeller Institute of Government’s annual Balance of Payments (BOP) report has shaped a powerful narrative about Virginia’s relationship with the federal government.
According to the Rockefeller Institute’s calculations, the Old Dominion sits at the very top of the list of so-called “taker states,” receiving far more in federal spending than it contributes in federal taxes. This ranking has been repeated so often that it has become an article of faith for many commentators. The implication is that Virginia’s prosperity—particularly Northern Virginia’s prosperity—is somehow subsidized by taxpayers elsewhere.
Although this assertion has become the conventional wisdom for some, this conclusion rests far more on how the numbers are computed than on the reality of who actually benefits from federal spending. When the assumptions underpinning the Rockefeller methodology are examined carefully—and when more realistic assumptions are substituted in their place—a very different picture emerges. Under a more sensible interpretation of federal expenditures and federal revenues, Virginia appears not as the country’s biggest taker, but as a net contributor to the Union.
How does the Rockefeller Institute of Government (RIG) calculate the balance of payments of federal revenues and expenditures among the states in the US?
The Rockefeller Institute attempts to measure the flows of money between the federal government and each state as part of its Balance of Payments (BOP) analysis. The BOP framework begins with the federal budget, breaks spending down into major categories, and then allocates each category to states based on where money is disbursed or where activity formally occurs. Revenues are allocated based on where taxes are collected or where taxable economic activity takes place.
The result is a state-by-state ledger that purports to show how much each state pays in and how much each receives. But the ledger depends entirely on the assumption that the state where federal dollars are spent is the state where the benefits of those dollars accrue. In practice, this assumption is deeply flawed.
The conceptual pitfall of the Rockefeller Institute’s methodology
Year after year, the Rockefeller report places Virginia at the top of the list of net recipient states. The presence of major military installations, federal agencies, and federal contractors means that billions of federal dollars are formally “spent” in Virginia. This is because Rockefeller’s methodology counts every one of those dollars as a benefit to the Commonwealth.
This conclusion, however, does not survive closer inspection. The key question is not where each federal dollar is spent, but who actually benefits from the spending, and whether that dollar represents a redistributive transfer, a payment for services, or a purchase of goods. Once these distinctions are introduced, the image of Virginia as America’s largest ‘taker’ begins to crumble.
The core weakness of the Rockefeller approach is conceptual. Its analysis is predicated on the assumption that every dollar the federal government spends in a state represents an equal and direct benefit to that state, regardless of the nature of the purpose of the spending. It treats every Social Security check, every military paycheck, every weapons system contract, and every federal salary payment as if it were identical to a grant program that provides fiscal transfers to households or state governments. This one assumption—simple and convenient, but incorrect—drives its results.
The result is a distorted picture that penalizes states that perform national functions—especially states like Virginia, Maryland, or Hawaii—while obscuring the real patterns of redistribution in the federal system.
What is the impact of the faulty methodology, in a world where the limitations of the methodology are not well-understood?
The misinterpretation of the Rockefeller findings creates a damaging political dynamic. States that host federal facilities, federal employees, and federal contractors are cast as net beneficiaries, even though these facilities, employees, and contractors serve the entire nation. This fuels narratives in which regions like Northern Virginia are portrayed as fiscally privileged, dependent on federal dollars, or somehow less deserving of equitable treatment in state funding formulas.
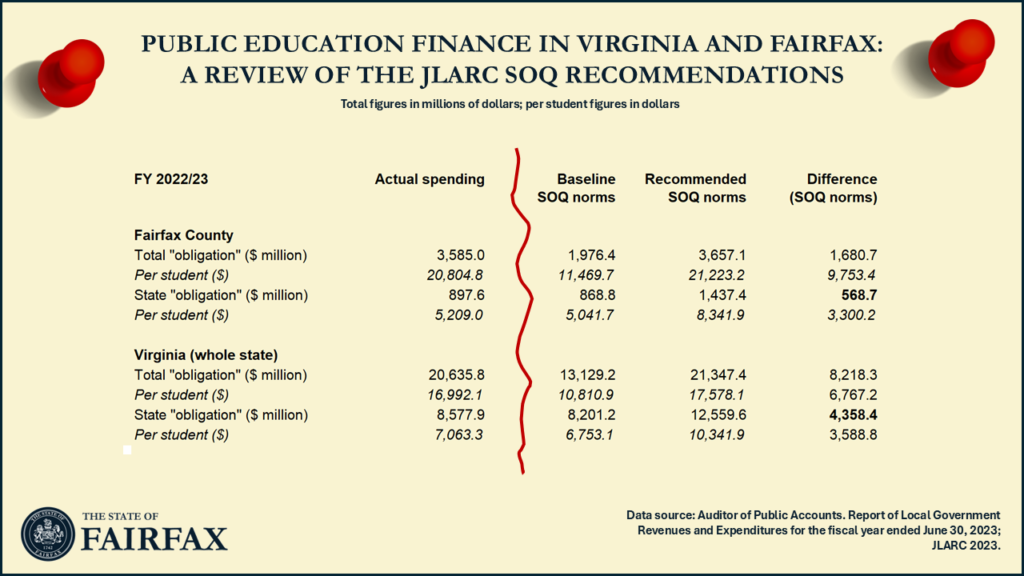
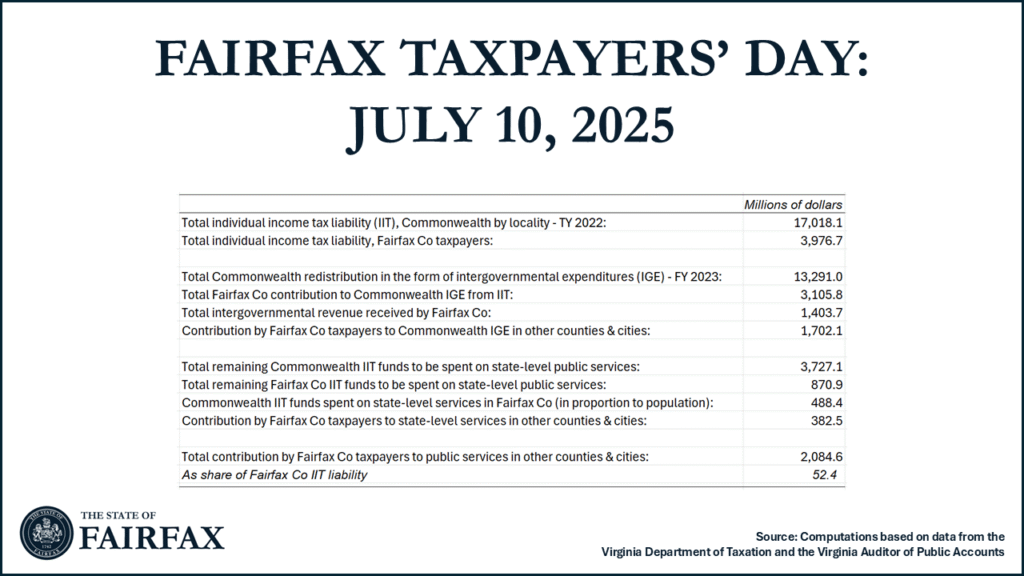
Such claims influence policy debates in Richmond, encourage complacency about chronic underfunding of high-cost, high-capacity counties, and obscure the extent to which local taxpayers in places like Fairfax County subsidize other jurisdictions within Virginia. When pundits or legislators justify inequitable state funding by saying, “You get so much federal money anyway,” they are relying on a flawed understanding of federal fiscal flows.
The conceptual error thus feeds directly into political decisions that have real consequences for public services across the Commonwealth.
Within Virginia, the narrative that Northern Virginia thrives solely because of federal money has been repeated so often that it has become a shorthand explanation for the region’s economic strength. Yet this explanation is both simplistic and wrong. The federal presence in Northern Virginia is a reflection of the region’s talent, capacity, and strategic location, not the cause of its prosperity. The wages earned by federal employees are payments for labor, not fiscal gifts. The procurement dollars booked to corporate headquarters reflect national defense spending, not transfers to local governments.
By confusing where federal dollars appear on paper with the actual economic and fiscal benefits of federal spending, the Rockefeller methodology unintentionally reinforces stereotypes that have little grounding in economic reality. And these stereotypes, when weaponized in state or national debates, create a distorted understanding of Virginia’s role within the federal system as well as a distorted understanding of the pbulic sector’s role in the national economy.
Faulty assumptions lead to faulty conclusions
In order to track the incidence of federal revenues and spending, the Rockefeller methodology divides federal expenditures into five categories: direct payments to individuals, contracts, wages, grants, and COVID-19 emergency spending. Each category is subsequently assigned to states based on administrative or accounting data, rather than on economic incidence or the location where benefits are realized. Examining each category reveals the specific problems.
Across all these categories, however, the central flaw is essentially the same: the place where money is spent does not reliably indicate the place where the real fiscal benefits accrue.
Direct Payments. Direct payments by the federal government—primarily Social Security and Medicare benefits—constitute the largest portion of federal spending allocated in the Rockefeller BOP analysis. But most direct payments to individuals are not transfers in the ordinary sense. They represent payouts from an earned-benefit system to which workers contribute throughout their careers. When these payments are treated as though they are discretionary federal subsidies flowing into the states where retirees or recipients currently live, the analysis becomes unmoored from economic reality.
Let’s consider a lifetime resident of Wisconsin who retires in Florida, and thus receives Social Security checks in Florida. Rockefeller’s methodology counts these payments as a federal benefit to Florida. But the payment was earned by the worker, reflecting the social security contributions made over his or her lifetime. As such, the payment is tied to the worker, not the state.
Mixing apples and oranges by including both general federal expenditures and direct payments when computing a single “balance of payments” will result in clear regional biases. Any state with significant in-migration of retirees will look artificially like a net beneficiary, whereas bad-weather states will artificially look like net contributors.
Contracts. The next category, federal contracts and procurement, is another area where the Rockefeller methodology creates distortions. The federal government purchases a wide range of things including, aircraft, ships, IT systems, weapons platforms, medical equipment, scientific services, construction, and countless other goods and services.
There are three reasons why it is problem to count federal procurements as money spent in each state, equivalent in nature to federal grants or other transfers. A first concern is that purchases are not fiscal transfers; they are economic exchanges. The federal government receives valuable assets or services in return for each purchase or contract.
A second concern is that the Rockefeller approach assigns the full dollar amount of each contract to the state where the prime contractor is headquartered, rather than where the economic activity takes place. A multibillion-dollar contract awarded to a Virginia-based company may involve thousands of workers in California, Texas, or Alabama. The benefit flows through complex production chains that stretch across the entire national economy. Assigning the expenditure solely to Virginia is analytically indefensible.
Thirdly, the actual benefits of federal procurements—particularly defense procurements —are often national in nature. A nuclear aircraft carrier built in Newport News protects the entire country, not merely the city or state where it was built. Treating procurement dollars as local “benefits” ignores this basic principle of public finance.
Wages. Federal wages, including salaries for civilian employees and military personnel, are counted in full as benefits to the states where employees are stationed. Yet these wages are payments for work performed on behalf of the nation. An Army General employed at the Pentagon is providing a service to the nation and is being compensated for that service. It is ludicrous to pretend that this salary payment reflects a dollar-for-dollar benefit to Virginia.
The secondary fiscal and economic benefits of federal payroll spending, such as state and local taxation and multiplier effects caused by local consumption are real but modest when compared to the face value of federal wages. Yet, the Rockefeller methodology ignores the difference between compensation and redistribution. It conflates the presence of federal workers with fiscal advantage, even though the primary beneficiary of their work is the federal government itself.
Grants. Grants are the one category where the Rockefeller allocation of federal funding to different states is largely defensible. Federal grants—including Medicaid, highway funding, TANF, SNAP, and education aid—are intended to support state and local governments and vulnerable populations. They are genuine transfers whose benefits are realized within the states that receive them. Grant data thus provides meaningful insight into redistributive flows across states.
COVID-19. Assigning COVID-19 emergency spending to states as if it were ordinary federal expenditure creates additional distortions. Pandemic relief legislation involved trillions of dollars, much of it financed through federal borrowing. States received large but temporary injections of federal funds that do not reflect long-term patterns of redistribution. Counting these funds as durable fiscal benefits, while ignoring the nationwide obligation to repay the debt, results in an incomplete and misleading assessment of state-level fiscal incidence.
Federal revenues. On the revenue side, the Rockefeller methodology is generally more robust, but it still mixes conceptually distinct categories. The most problematic inclusion is payroll taxes, which fund Social Security and Medicare and therefore represent contributions to an earned-benefit system rather than general federal revenue. Treating payroll taxes as contributions to the general fund exaggerates the apparent fiscal burden borne by high-employment states.
Corporate taxes present a different challenge. Many companies operate across states, and it is difficult to assign federal corporate income tax payments to any one state in a way that reflects the true economic burden on workers, consumers, or shareholders. Nevertheless, these issues are less severe than the distortions created on the expenditure side.
Computing an alternative estimate of fiscal incidence across states
To understand the real fiscal relationship between the federal government and the states, it is useful to construct an alternative model of fiscal redistribution. This can be done using the Rockefeller data but applying more realistic assumptions about the incidence of federal spending and revenue.
As a first step, computing an alternative estimate of fiscal incidence across states begins by removing Social Security and Medicare from both sides of the ledger, recognizing that these programs reflect earned benefits rather than redistributive flows. The remaining allocations of federal revenues among the states is left in place.
Second, federal wages and procurement spending are allocated proportionally across the national population, recognizing that these are payments for services rendered, rather than payments to states or subsidies to households or businesses. Furthermore, the benefits of these expenditures—especially in defense—are generally national rather than local in nature.
Third, the distribution of grant expenditures is recognized as they are, since they represent genuine transfers, redistributing federal resources from some parts of the United States to others.
Fourth, COVID-19 spending is excluded to avoid conflating temporary, debt-financed expenditures with ongoing fiscal patterns.
Finally, in order to avoid the appearance that “everyone is a winner” as a result of considerable federal deficit spending, the alternate methodology focuses exclusively on the distribution of federal spending that is funded from available federal revenue sources. In short, this means that all of the expenditure benefits of federal revenues—other than grants expenditures—are distributed among the states in proportion to population, whereas the benefits of grant expenditures are assumed to correspond to the state where they are allocated and transferred.
As a caveat, it is important to note that—as we say in economics—data is a four-letter word. If we had more access to granular federal spending data, classified by function, program, location, and spending type, it would be easier to prepare more detailed and more granular fiscal incidence estimates. Furthermore, the current analysis ignores the impact of cost-of-living differences on the real benefit of federal spending in different states or localities. For instance, the actual impact of a million dollars in food stamps in a high-cost state (say, Alaska) will be considerably less than the impact of a million federal dollars in food stamps in a low-cost state or area.
Results
When the numbers are recalculated under these assumptions, the result is clear: Virginia emerges not as the country’s largest beneficiary, but as a net contributor. The Commonwealth shifts from being ranked number 1 (the top “taker” state) to being ranked in the 39th position, landing on the contributor side of the ledger (as a “maker” state). This result confirms that Rockefeller’s designation of Virginia as having a surplus in the federal balance of payments is an artifact of methodological choices rather than economic reality.
The transformation in Virginia’s position once the methodology is corrected is striking. The state that the Rockefeller report claims is the greatest net beneficiary of federal spending becomes, upon reinterpretation, a state that contributes more to the federal system than it receives. This shift also affects a handful of other states with large federal footprints, including Maryland and Hawaii, while leaving many other states’ positions relatively unchanged.
Click toggle to see detailed scatter plot…
The recalculated rankings better reflect the true nature of the federal system. States with high poverty rates or large populations of vulnerable residents are net beneficiaries, as intended by progressive federal tax and expenditure policies. States with high incomes and strong tax bases are net contributors. The largest changes in the rankings are caused by changes in the treatment of states that host major federal installations or headquarters. Those states are no longer misclassified as fiscal free riders simply because they are home to national institutions.
Conclusions
The Rockefeller Balance of Payments report fills an important role in the policy debate, by providing clear, consistent, and politically salient metric for public policy debates about the distribution of federal funds among states. The analysis presents complex federal fiscal data in an accessible format by presenting a simple “giver vs. getter” (or “taker” versus “maker”) state ranking and a “return on the dollar” metric. This makes the findings easy to understand and communicate to the public and the media, facilitating widespread use of the ranking in general news stories and political discussions.
It is important, however, not to interpret the balance of payment results as a definitive measure of inter-state fiscal fairness. Its simplified methodology, while useful for narrative purposes, obscure important nuances about how different programs serve different populations and regional needs. Its methodology conflates procurement with redistribution, misallocates national spending to local jurisdictions, and treats earned benefits as transfers. These flaws disproportionately affect states like Virginia, whose economies are intertwined with federal functions that serve the entire nation.
In an era of rich administrative data and rapid advances in AI and economic modeling, it is both possible and necessary to construct a more nuanced understanding of federal fiscal flows. Such an understanding would avoid penalizing states for hosting national institutions and would illuminate the real, underlying patterns of redistribution across the country.
Virginia is not the nation’s biggest taker. It is a major contributor to the federal system, a linchpin of national defense, a center of federal governance, and an economic engine whose benefits extend far beyond its borders. Replacing misleading narratives with accurate fiscal analysis is essential—not only for national understanding, but for ensuring that Virginians receive fair treatment within the Commonwealth’s own intergovernmental system.