
According to the Virginia Auditor of Public Accounts, local governments (counties and cities) in Virginia spent a total of 39,829,847,190 dollars in FY 2024. This excludes spending in the 23 jurisdictions (out of 95 counties and 38 independent cities) that did not report their audited accounts to the Virginia Auditor of Public Accounts.
The level of local government expenditures considerably across Virginia, from 12.1 million dollars in Highland County (population: 2,251 residents ) to 6.7 billion dollars in Fairfax County (population: 1.1 million residents) .
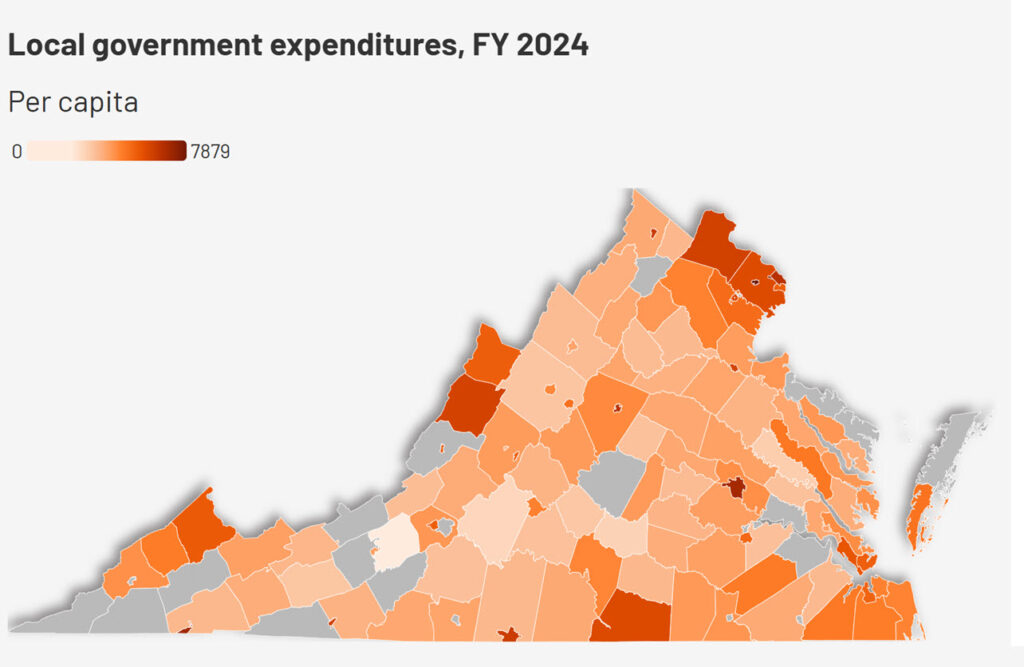
Per capita local government expenditures
Because the population varies considerably across counties and cities, it is most useful to compare local government expenditures in per-person or per capita terms. In per capita terms, local government expenditures vary from 7,879 dollars per person (Fairfax City) to 2,227 dollars per person (Montgomery County).
The total level of (per capita) local government spending in each county or city is driven by the preference or demand for local public services within each local community, and the ability and willingness of local residents (taxpayers and voters) and their locally elected representatives to impose and collect local taxes–such as local property taxes–from households and businesses within the local jurisdiction.
Disparities in local government expenditures on public services and infrastructure also reflect underlying variations in service delivery costs (for instance, due to scale economies or due to labor market conditions), as well as broader contextual factors such as demographic composition or socio-economic conditions unique to each locality.
In addition, local government spending levels are determined in part by the level of intergovernmental funding provided by higher-level governments (either the federal government or the commonwealth government). Finally, expenditure levels may be influenced by the ability and willingness of local governments to engage in borrowing.
The most obvious patterns are the higher per capita expenditures in independent cities, many of which either tend to have a relative small population or higher urban costs. Northern Virginia likely faces a high demand for local public services due to higher household incomes, in addition to facing higher costs. In addition, there are a number of rural jurisdictions in Appalachian Virginia and Southside that are the recipients of considerable intergovernmental revenues from the Commonwealth, allowing them to spend well-above average despite being low-income, low-tax jurisdictions.
Functional composition
Local government spending is broken down into eight main functional categories, including (1) general government administration; (2) judicial administration; (3) public safety; (4) public works; (5) health and human services; (6) education; (7) parks, recreation, and cultural; and (8) community development. Remaining miscellaneous expenditures are indicated as non-departmental.
In aggregate, education (53.9%), public safety (16.8%), and health and human services (10%) are the largest functional spending categories at the local government level.
Detailed local government spending by function
More details for the expenditure composition of each local government by function–again, in per capita terms–is provided in the bar diagram below.
Real (cost-adjusted) local government spending
Just like a comparative analysis requires local government expenditures to be compared in per-capita terms, it would be appropriate to take into account the large differences in costs that different local government jurisdictions face. For instance, the federal government aims to ensure fair compensation by aligning federal employee salaries with the cost of living in different geographic locations.
Given that the salaries and wages form the main category of local government expenses, it would be appropriate to express local government expenditures in real terms by adjusting local expenditures based on a cost-of-locality adjustment.
There are few consistent indicators available that measure differences in local government costs. The measure used for cost-of-locality adjustments by the U.S. Office of Personnel Management (OPM) is rather imprecise, as it is based on metropolitan-wide cost indicators. Perhaps the best measure local cost variation is the Economic Policy Institute’s Family Budget Calculator, which measures the income a family needs in order to attain a modest yet adequate standard of living. The household budget estimates reflect community-specific costs for standard family types in all counties in the United States. As such, a cost-of-locality index based on EPI’s family budget requirements–which accounts for the fact that salaries reflect approximately half of local government spending–provide a consistent measure of local cost variations faced by local governments.
The cost-of-locality adjustment does not seem to make major changes to the overall pattern or incidence of local government expenditures in Virginia. Most significantly, real expenditures are lowered in Northern Virginia compared to the rest of the commonwealth, as this part of the commonwealth not only has higher household incomes and a greater demand for local public services, but also faced considerably higher costs.
Detailed real (cost-adjusted) local government spending by function
The detailed expenditure composition of each local government by function–in per capita, cost-adjusted terms–is provided in the bar diagram below.